It’s Akitu tomorrow, an ancient Assyrian and Babylonian festival which celebrates the start of spring and barley growing season. It’s also the start of Nisan, the first month of the Assyrian calendar (also Babylonian and Hebrew). I start with Akitu because life in itself is structured around seasons. A time for everything as Ecclesiastes 3 tells us – ups, downs and many things in between.
As markets move up and down, we tend to get lost in the day to day and miss the seasonal changes. The cycles. Every asset class, like the world itself, has its own season and cycle. Many times this is explained as mean reversion — going back to the mean (average) price over a certain period.
Mean reversion is the single biggest reason that smart money survive and about 90% of retail derivative traders lose 90% of their money within 90 days (90/90/90 rule). The smart guys know that in order to win in investing, you need to survive. The only way to survive is to manage risk and understand that markets always, always, move in cycles.
“If you want your business to survive for 100 years, you've got to make it through every single day for 100 years. It's not enough to do it 99.9% of the time.” - Warren Buffett
There’s a big error though in the mean reversion ideology and that is largely mathematical. Mean reversion doesn’t necessarily mean that prices will move down after rising or rise after fall. It just means the price action will track the average throughout the cycle. A sustained period of rising prices however naturally pushes the average up, the same with falling prices.
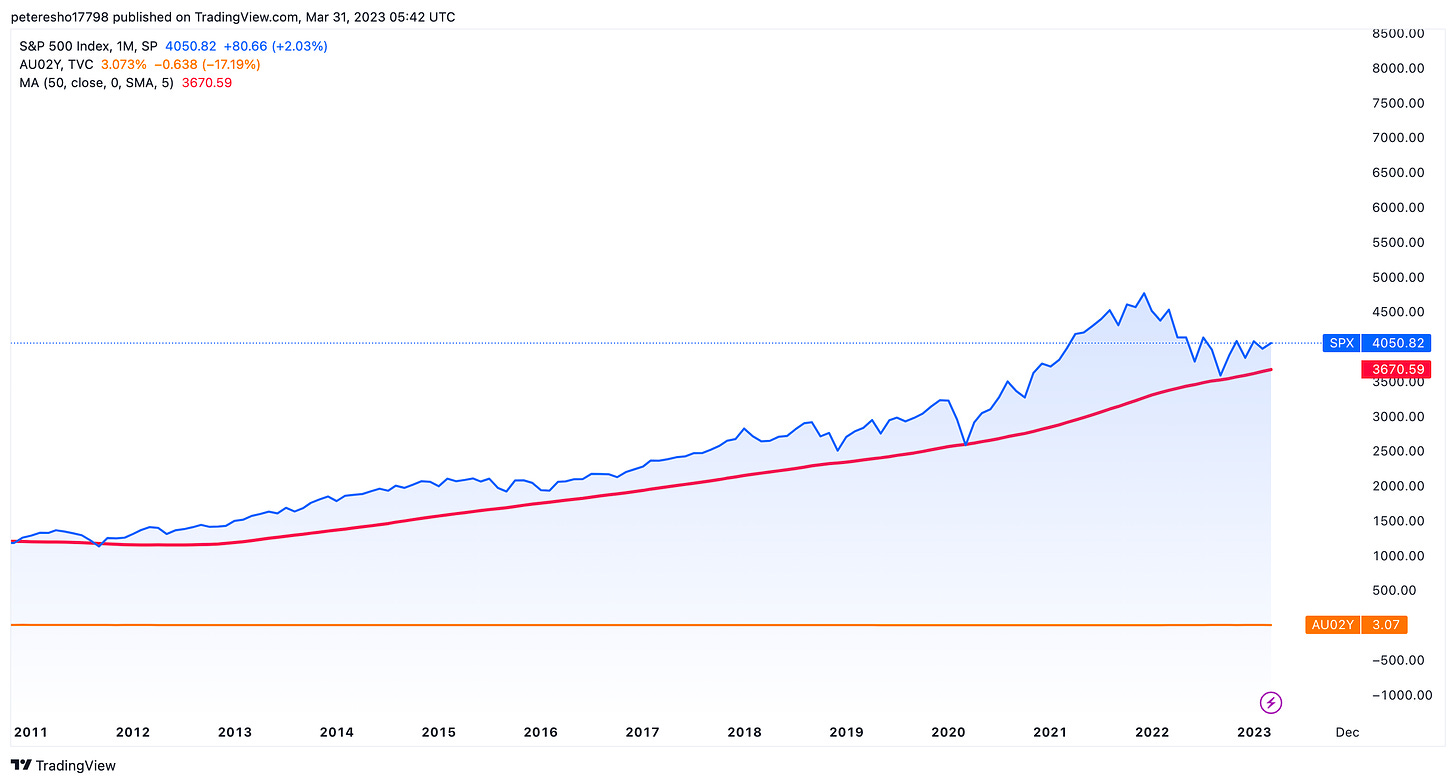
Take for example the S&P500 index, below is the weekly price chart with 50-week moving average.
Investors who were waiting for mean reversion in mid 2021 got it in early 2022, but at prices that were almost 30% higher. If the market is rising and stalls, you could have mean reversion just by the mean catching up and a small pullback in price.
Mean reversion is only a half told story, the most important part of every investment conversation needs to be the timeframe of the cycle. Mean reversion in a 2-year cycle is different to a 10-year cycle. Completely different numbers, completely different outcomes.
If we zoom out of the chart above and go back 12 years, instead of 4, we see a much more different picture.
Investors who were waiting for mean reversion in 2012 got it in the 2020 pandemic, but at double the prices. The price of the S&P500 did revert to mean, but buying above mean would have been much more profitable than waiting for a pullback.
The cycle length is the hardest part of investing. Understanding the length of the cycle is the key. There’s no simple answer, this is the art of investing. The art of picking the cycle and understanding how to manage positions in the event that you get it right or wrong.
Each week we use classical artwork in our thumbnail links as a source of inspiration. See this week’s artwork here.


Thanks Peter... a timely 'big picture' reminder as we invest each day